AWS Security Monitoring using CloudWatch Agent
AWS Cloud Hands on Lab Practice Series
Elevating Security with AWS CloudWatch Monitoring and Alerts
Project Overview —
This project revolves around AWS SysOps best practices where we configure an Amazon Linux instances to send log files to Amazon CloudWatch and then create Amazon CloudWatch alarms and notifications to alert for a specified number of login failures on our EC2 instances. Finally, we create a CloudWatch alarm and notification to monitor outgoing traffic through a NAT gateway. By leveraging AWS CloudWatch capabilities we stay proactive & cover observability of our AWS Infrastructure.
SOLUTIONS ARCHITECTURE OVERVIEW -

First Let’s understand the real world use case -
- Web Application Security Monitoring — Real-time alerts will help us identify and respond to unauthorized access attempts. Monitoring failed logins across our instances helps us spot potential brute-force attacks. We can take immediate action, such as blocking IP addresses, when CloudWatch alarms trigger.
- Compliance and Auditing for Critical Services — Detailed logs and alerts provide the necessary evidence for compliance audits. We can set up CloudWatch alarms to detect deviations from security and compliance policies in real-time. Notifications can be used to inform security teams or compliance officers when an alarm is triggered, enabling swift remediation.
- Network Traffic Analysis for Cost Optimization-Real-time alerts will help us identify spikes in outgoing traffic that could lead to unexpected AWS data transfer costs. Monitoring traffic patterns allows us to make informed decisions about scaling resources up or down. We can automate scaling actions or adjust your application’s behavior based on traffic trends.
- Application Performance Monitoring-Set up custom CloudWatch dashboards to visualize critical metrics and detect performance bottlenecks. Create CloudWatch alarms to trigger notifications when metrics exceed predefined thresholds, indicating potential performance issues. We can integrate CloudWatch with AWS X-Ray for end-to-end tracing and monitoring of application requests.
- Serverless Application Monitoring-Set up custom CloudWatch Metrics to track specific business-related events or performance metrics within your serverless application. Use AWS CloudWatch Insights to perform advanced log analytics and gain deeper insights into function behavior. Implement AWS Step Functions to orchestrate serverless workflows and monitor their execution using CloudWatch Metrics and Alarms.
These use cases demonstrate the versatility of Amazon CloudWatch in monitoring and managing various AWS resources and services, from traditional EC2 instances to serverless applications. By leveraging CloudWatch, we can enhance security, optimize costs, and maintain compliance across various scenarios in real-world AWS environments. By effectively utilizing CloudWatch features, we can proactively manage and secure your infrastructure while meeting specific business needs and objectives.
Prerequisite —
- AWS Account with Admin privileges
- Access to CloudFormation, EC2, CloudWatch, IAM
AWS Services Usage —
AWS VPC, IAM, EC2, CloudWatch
STEP BY STEP GUIDE -
STEP 1 : Deploying the proposed architecture Infrastructure.
- Download the CloudFormation template from the Repo.
- Create a new stacks for both the templates.
- This CloudFormation stacks will deploy resources required for this hands on Lab (2 EC2 Instance, NLB, VPC, Nat Gateways, Lambda Functions, IAM roles & policies)
- It will take around 5–10 mins for entire Infrastructure to become active.
STEP 2 : Deploying the CloudWatch Agent on DB Instance
- Go to EC2 dashboard, select Database Server Instance.
- Connect to Instance through AWS session manager.
- Now, Install the CloudWatch agent package using below command
- sudo yum install -y amazon-cloudwatch-agent
- The CloudWatch agent installer creates a new user named cwagent.
- Now provide read and run access to the /var/log/secure file for the cwagent user.
- sudo setfacl -m u:cwagent:rx /var/log/secure
- We are only sending security logs to CloudWatch & hence we gave access to /var/log/secure only.

STEP 3 : Start the CloudWatch Agent on DB Instance
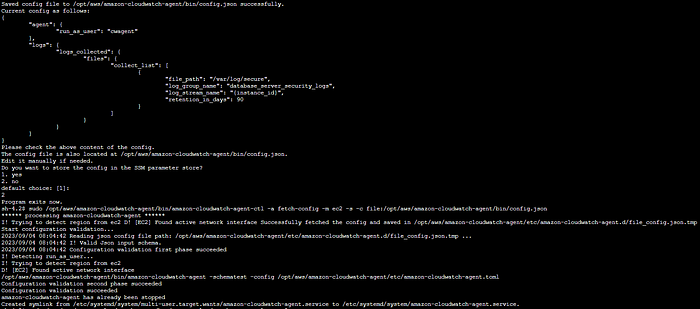
- Run the below command to start the CloudWatch agent configuration wizard
- sudo /opt/aws/amazon-cloudwatch-agent/bin/amazon-cloudwatch-agent-config-wizard
- We will see the wizard opens with the following options:
- Enter 1 for Linux
- For Are you using EC2 or On-Premises hosts, enter 1 for EC2.
- For Do you want to turn on StatsD daemon, enter 2 for no.
- For Do you want to monitor metrics from CollectD. enter 2 for no.
- For Do you want to monitor any host metrics, enter 2 for no.
- Do you have any existing CloudWatch Log Agent configuration file to import for migration, enter 2 for no.
- For Do you want to monitor any log files, enter 1 for yes.
- For Log file path, enter /var/log/secure
- For Log group name, enter database_server_security_logs
- For Log stream name, press ENTER to keep the default value of Instance ID
- For Log Group Retention in days, enter 9 for 90
- For Do you want to specify any additional log files to monitor, enter 2 for no.
- For Do you want to store the config in SSM parameter store, enter 2 for no.
- Now lets start the CloudWatch agent service:
- sudo /opt/aws/amazon-cloudwatch-agent/bin/amazon-cloudwatch-ahgent-ctl -a fetch-config -m ec2 -s -c file:/opt/aws/amazon-cloudwatch-agent/bin/config.json
- We will see the information about the configuration file that is loaded by the agent.
- Check CloudWatch agent service status- sudo /opt/aws/amazon-cloudwatch-agent/bin/amazon-cloudwatch-ahgent-ctl -m ec2 -a status



STEP 4 : Generate Auth failures in the security logs
- Run the following command to log in as dbdev :
- su dbdev
- when prompted for a password, try to give wrong creds (to create auth failures)
- Repeat this process for 4–5 times to generate logs.

STEP 5 : Check log files in CloudWatch Logs
- Navigate to CloudWatch -> logs -> log groups
- On the log groups, select the group by the name database_server_security_logs log group.
- On the database_server_security_logs, choose Log streams tab.
- We will see one log stream from DB server Instance.
- This will have security logs from DB server Instance.

STEP 6 : Create a Metric Filter
- On the database_server_security_logs page, choose the Metric filters tab.
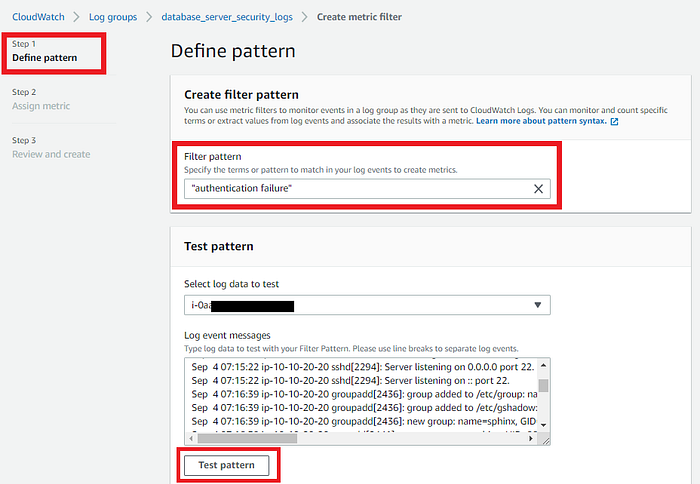
- Now create metric filter → Define pattern
- For Filter pattern, enter “authentication failure”
- In the Test pattern, select the EC2 Instance ID of DB server.
- Choose Test pattern -> Next
- For Assign metric, For Filtername give db server auth failures
- For Metric namespace, enter authentication failures & create new is on.
- For Metric name, enter db server auth failures
- Metric value 1 and Default value 0
- Now review & create -> choose Create metric filter.



STEP 7 : Create a CloudWatch alarm & SNS notification.
- On the database_server_security_logs page, choose the Metric filters tab, we will see db server auth failures filter.
- Choose Create alarm -> Specify metrics & conditions.
- For Metric name -> db server auth failures
- For Statistic -> Sum and Period -> 5 mins. (your choice)
- In the Conditions -> Threshold type select Static -> Greater -> 2
- Expand the additional configuration section & for Missing data treatment, select Treat missing data as good (not breaching threshold)
- Select Next -> Configure actions -> Notification
- For Alarm state trigger, select In alarm
- For Select an SNS topic, select Create New Topic.
- For Create a new Topic, enter DB_Cloudwatch_alarm_notifications.
- For Email endpoints -> enter your email address.
- Choose Create Topic -> Next -> Add name & description.
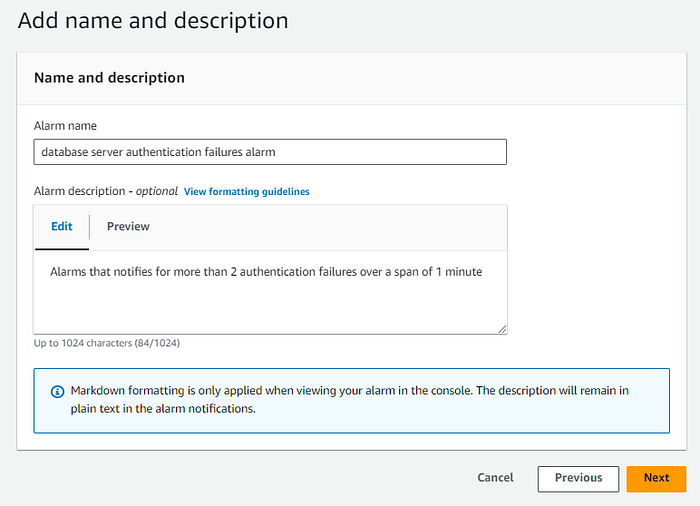
- For Alarm name -> database server authentication failures alarm
- For Alarm description -> Alarms and notifies for more than 2 auth failures over a span of 5 minutes ( you can edit according to your use case)
- Choose Next -> Preview and Create -> Choose Create alarm
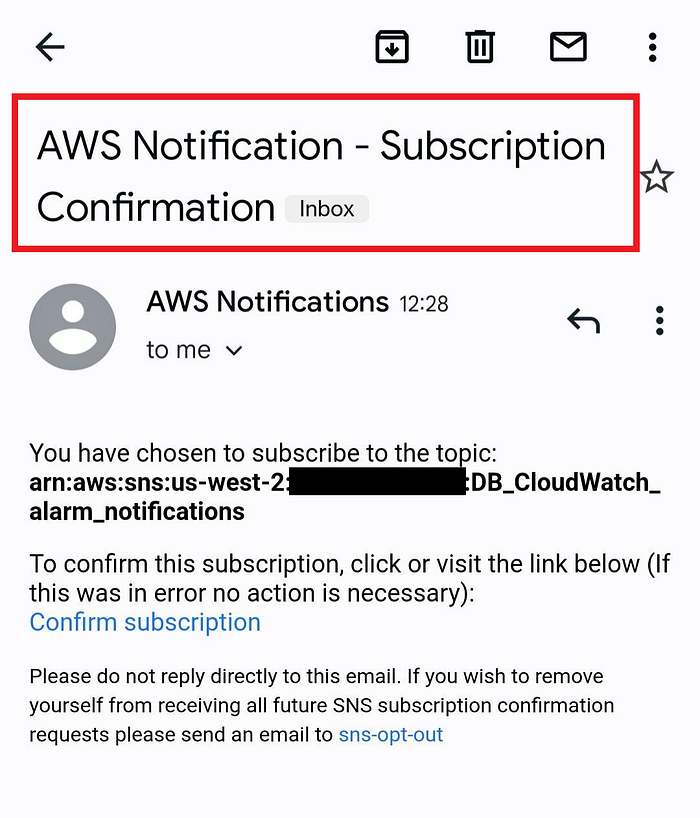
- Check email & we must confirm email address & then SNS can send notification messages.




8 : Test the alarm & SNS notification.
- Login to DB server again & hit su dbdev
- when prompted for a password, try to give wrong creds (to create auth failures)
- Repeat this process for 4–5 times to generate logs.
- Now we should get the notification on email as soon as alarm get in In alarm state.


STEP 9 : Lets monitor NAT Gateway
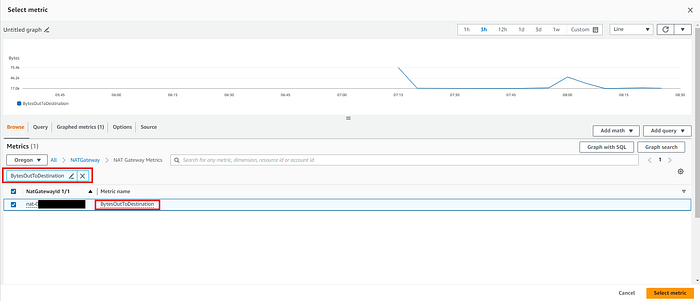
- Create New alarm → select metric -> Metrics -> AWS namespaces Choose NATGateway.
- Choose Nat Gateway Metrics
- Search for BytesOutToDestination in metric search bar.
- Select the NatGatewayId that matches the NatGatewayId value listed.
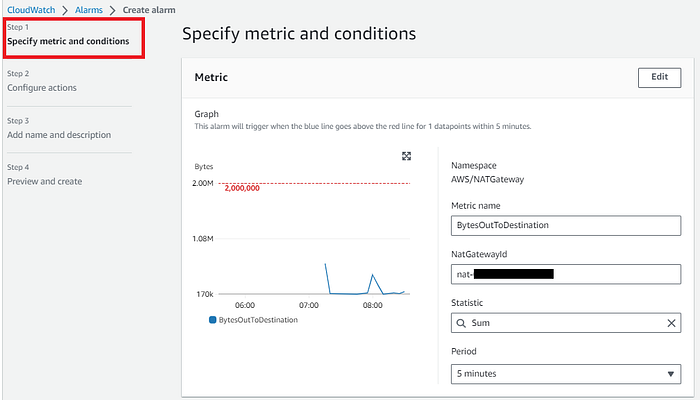
- Choose Select metric -> Metric Name -> BytesOutToDestination
- For NatGatewayId, verify it matches the NatGatewayId value
- Statistic -> Sum & Period -> 15 mins
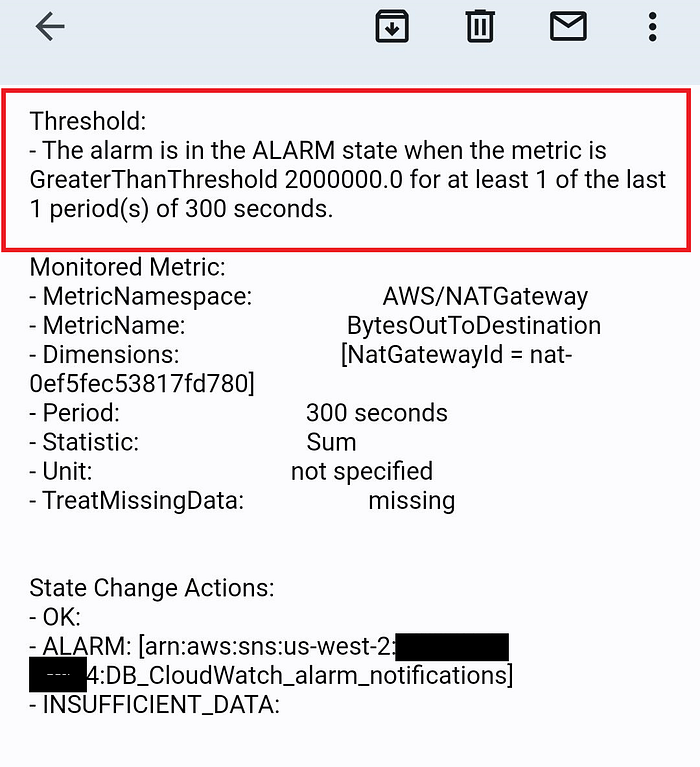
- In the conditions -> Threshold type -> Static -> Greater -> 2000000
- Choose Next -> Configure actions -> Notification -> Alarm state trigger -> In alarm
- Select SNS -> Existing topic ->DB_Cloudwatch_alarm_notifications (created earlier) -> Next
- Add Name & description according to your use case.
- Preview and Create, Choose Create alarm.



STEP 10 : Generate traffic & activate the alarm
- Upload any file which is higher than 5 MB to S3 bucket.
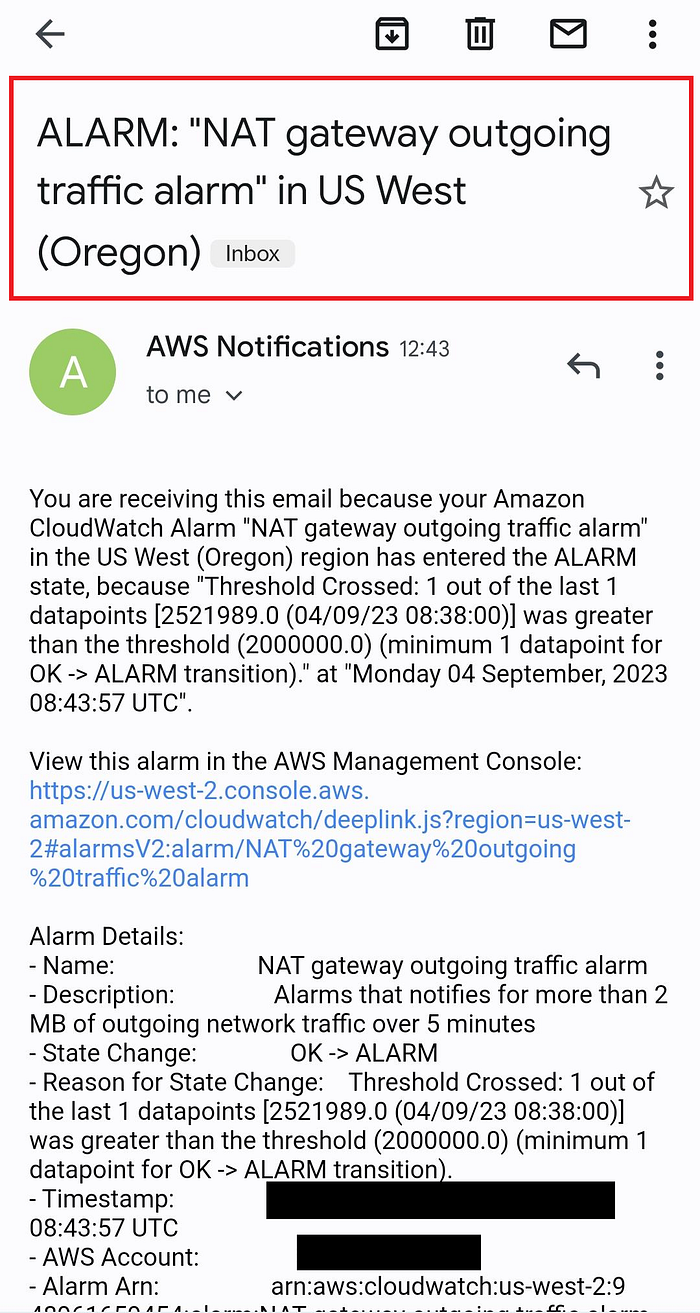
- NAT Gateway outgoing traffic alarm will go In alarm state.
- Check your email for notification email.

STEP 11 : Decommission
- Delete all the created alarm & SNS topics
- Delete the CloudFormation stacks from CloudFormation.
Congrats ! We have successfully completed lab for AWS Security Monitoring using CloudWatch Agent

I am Kunal Shah, AWS Certified Solutions Architect, helping clients to achieve optimal solutions on the Cloud. Cloud Enabler by choice, DevOps Practitioner having 7+ Years of overall experience in the IT industry.
I love to talk about Cloud Technology, DevOps, Digital Transformation, Analytics, Infrastructure, Dev Tools, Operational efficiency, Serverless, Cost Optimization, Cloud Networking & Security.
#aws #community #builders #devops #cloudwatch #natgateway #observability #proactive #incident #management #centralize #network #security #logging #monitoring #operations #controlled #infrastructure #authentication #control #acloudguy
You can reach out to me @ acloudguy.in
